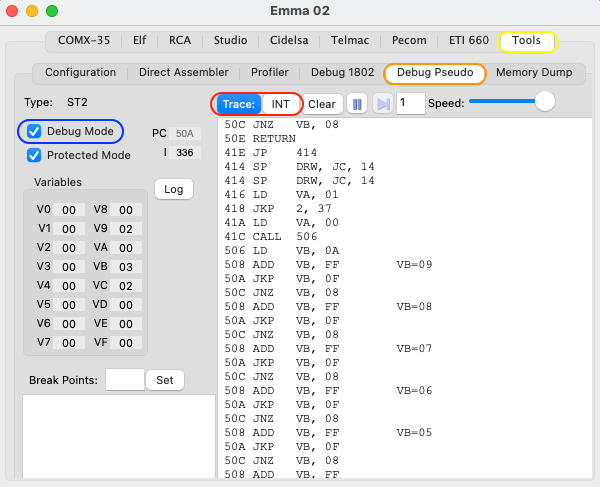
To use the pseudo trace functions of the debugger first select the 'Tools' tab (highlighted in yellow) and then the 'Debug Pseudo' tab (highlighted in orange).
To activate/deactivate the pseudo debug mode select/deselect the 'Debug Mode' checkbox (highlighted in blue). Debug mode is also activated and deactivated automatically when using any of the he pseudo trace commands (highlighted in red).
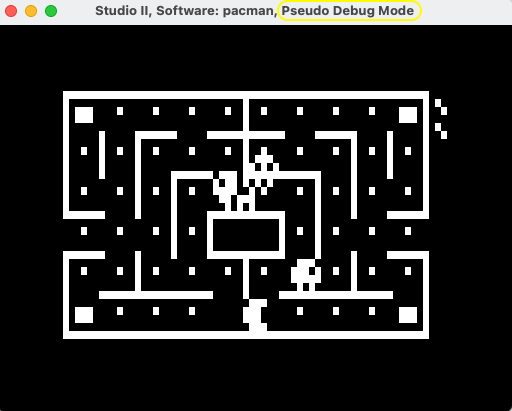
Active pseudo debug mode will be indicated in the emulated computer window title. Note that in pseudo debug mode the emulator will run slower and take more processor power.
There are 2 trace buttons to show or trace instructions executed by the emulated computer:
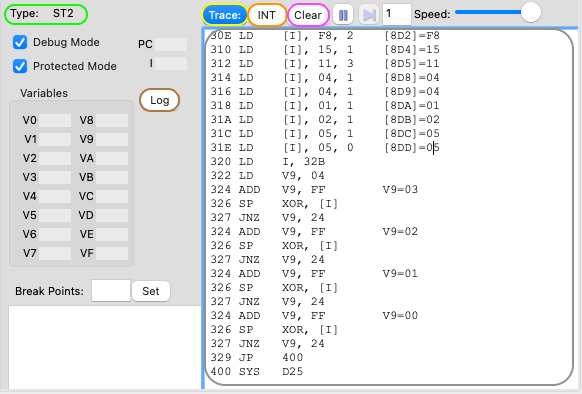
Tracing output will be shown in the trace output window (highlighted in grey). To save the output to a log file press the 'Log' button (highlighted in brown). The trace window cleared by pressing 'Clear' (highlighted in purple).
The type of pseudo code is shown in the Type field (highlighted in green).
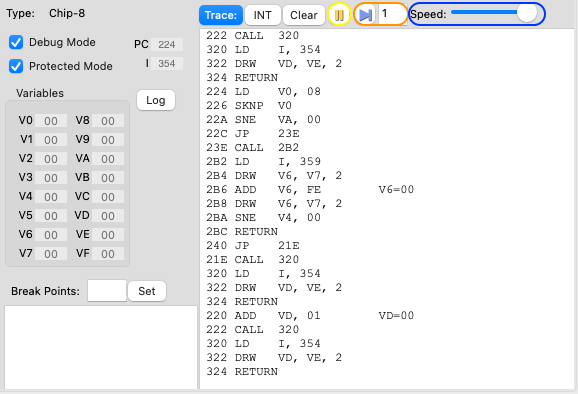
The pseudo code running on the emulated computer can be 'paused' by pressing the pause button (highlighted in orange) and will pause automatically when hitting a break point, see also section 'Break Points' below.
When Pseudo code is paused the pause button will light up orange and the title of the computer will include '** PAUSED **'. To continue just hit the pause button again. Note that when the pause button is pressed during execution of a pseudo code instruction, pseudo code is paused only when the current instruction is finished. During execution of the current instruction the pause button will be disabled. This is especially visible when pausing during a command like LD Vx, K in Chip-8, in this case the pause command will only take effect after a key press.
In pause mode the 'Step' button (highlighted in orange) can be used to get the emulated computer to execute the indicated number of pseudo code instructions and after this go back to pause mode.
If needed the trace and emulated computer can be slowed down by sliding the 'Speed' slider (highlighted in blue) to the left. Normal speed will be restored when Debug mode is switched off even if the slider is not fully to the right.
All variable (highlighted in orange), I register (highlighted in blue) and PC register values can be seen at any time:
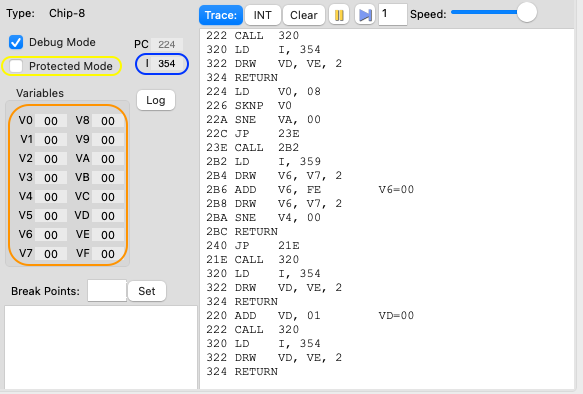
Default none of these values can be changed (protected mode), this is to protect execution of the emulated computer as changing these values would likely cause a crash. To change these values unselect the 'Protected Mode' checkbox (highlighted in yellow). The PC register is never allowed to be changed.
To change the value of registers I and/or variables, type in a different value and press enter. No value is changed until enter is pressed! Also be aware that changing values during run time of a computer might be difficult as the emulator constantly changes values. To make it easier to change something pause the emulator (via the pause button or breakpoint), change the value and continue tracing using pause (see sections, 'Pause, Step and Speed' and/or 'Break Points'.
Break points (highlighted in yellow) are handled with the button and fields marked in the screen shot below.
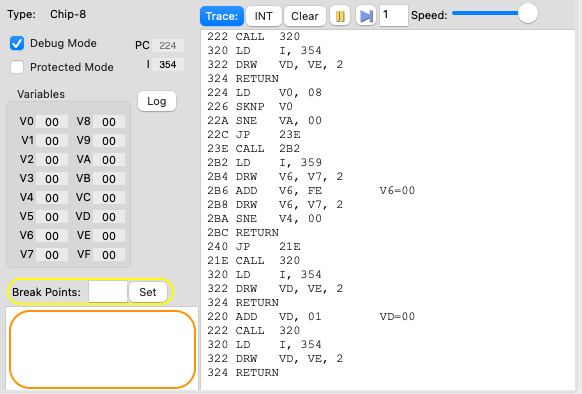
To set a break point on a pseudo code 'execution address' type the required address in the field next to the 'Set' button (highlighted in yellow) and press return (or the button). The address will be shown in the break point list (highlighted in orange). When the emulated computer reaches the specified address it will stop execution and go into 'pause' mode. A total of 64 break points can be set.
To delete a breakpoint select it in the list and press the 'Delete' key.
This feature is only available on Windows: to deactivate a breakpoint uncheck the applicable checkbox. To activate it again re-check the box.
To edit a breakpoint select it in the list and edit the text.