The Emma 02 emulator is able to emulate multiple computers all based on the RCA 1802 microprocessor.
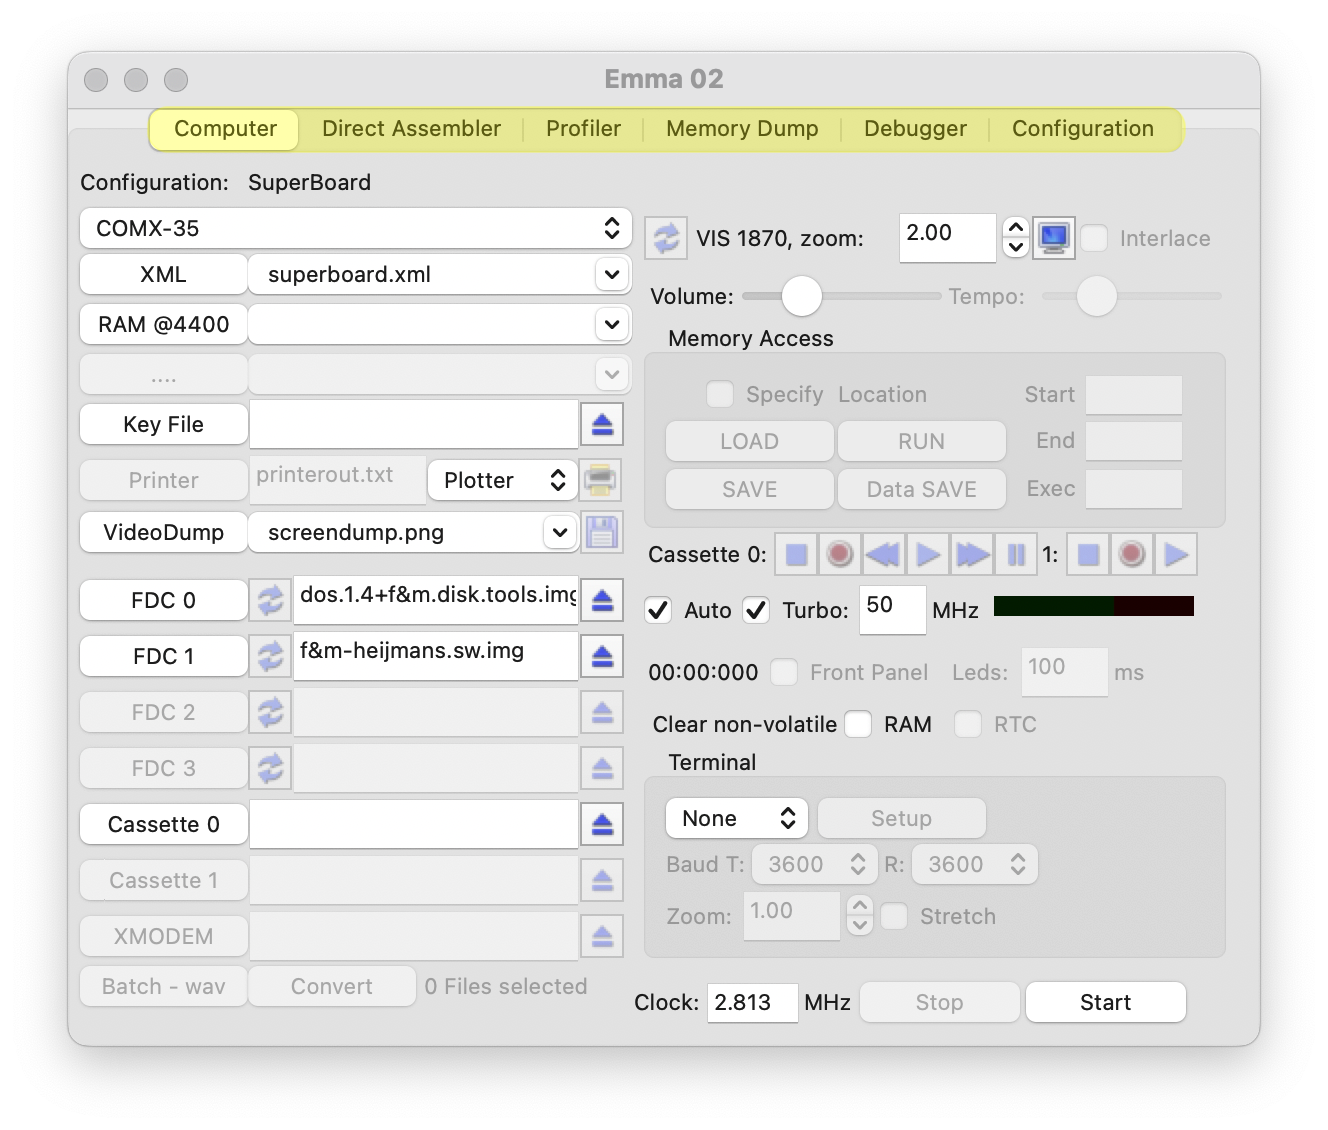
The GUI includes different tabs, to switch between these select the desired tab (highlighted in yellow) as shown in screenshot below.
The sections below describe the funcions for each tab. For information how certain computers work, have a look at my Emma 02 site in the 'Computers List' section. Some details how certain things are emulated can be found in the FAQ.
See section General for:
The main tab where the emulated Computer can be configured (by selecting pre-configured XML files), adjusted, controlled and started.
A powerful Direct Assembler (and disassembler), which depending on the running computer handles any 180x related code (SYSTEM00, 1801, 1802, 1804 and 1805/1806) as well as multiple pseudo code variants (Chip-8, Super-chip, ST2, ST4 etc.). See also the Syntax section for specification of the accepted syntax.
The assembler can be used for writing anything from small pieces of software to larger projects. The complete COMX Super Board FW was written using the Emma 02 assembler.
The Direct Assembler is very powerful for debugging and patching existing code. See also the Debugging Existing Code - Example for a short 'how-to'.
Main purpose of the Profiler is to find hot code spots, dead code, analyse code & test coverage as well as analyse timing for the running computer and CPU.
The Memory Dump shows an overview of one page (256 bytes) of memory, shown in hexadecimal format. Next to options to show regular and video memory it is also possible to show what type of memory (RAM, ROM, video etc) is connect or see an overview of the profile counters.
The Debugger, will (among other things) allow you to trace code, set break points or check specific register values. Two debugger tabs are available one for the 1802 and one for pseudo code.
The Configuration will show the high level configuration for the started computer, including all I/O details.